The Five Second Test
How to review your pricing page the way your customers actually read it.
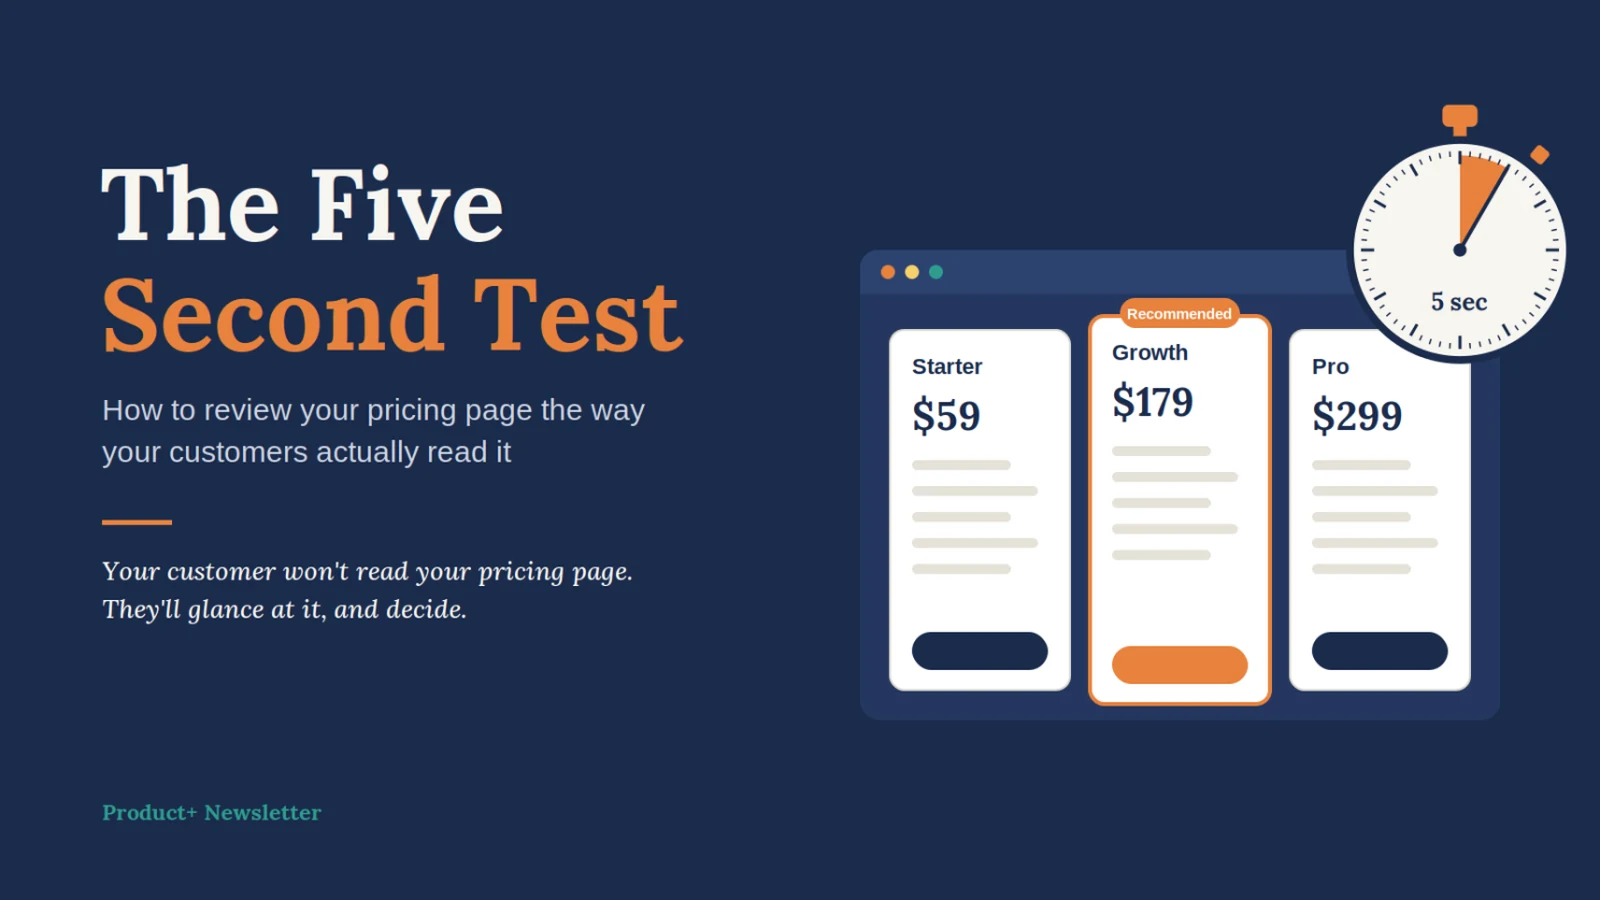
Your customer won't read your pricing page. They'll glance at it, and decide.
A month after rebuilding Cadence's pricing, Jordan opened the dashboard expecting good news. Traffic to the pricing page was up almost a third. The sales team was sending more prospects there than ever. And the number of clinics starting a free trial from that page had barely moved.
She scrolled through the page itself, and for the first time she saw it the way a stranger might. It had become a museum of good ideas. Four plans climbing a gentle staircase. A published enterprise anchor. A monthly and annual toggle. Reminder packs that crossed over to the Plus plan at exactly $99. Messaging credits with a break even note. A footnote explaining the footnote. Every element had a good reason to be there. Together they made a wall.
So Jordan tried something she should have done before launch. Through a friend, she found three office managers at clinics that had never heard of Cadence. The first was Denise, who runs the front desk at a four doctor pediatric practice. Jordan opened the pricing page on a laptop, started a timer, and asked one question: "Which plan would you buy? Just talk out loud while you decide."
Denise scrolled down to the toggle, then back up. She hovered over the Plus card, then asked what a reminder pack was. She found the credits note, read it twice, and laughed. At ninety seconds she leaned back and said, "Honestly, I'd probably just call someone."
At Cadence, calling someone usually meant leaving. Jordan had designed the page for a reader like herself, someone who read it slowly, top to bottom, already knowing the product. Real customers don't read pricing pages. They glance at them, form an impression in a few seconds, and either lean in or move on.
That afternoon, Jordan started building a way to review the page the way customers actually see it.
Start with the glance
The simplest version of the test takes five minutes and one willing stranger. Show them your pricing page for five seconds. Then hide it and ask three questions.
- What does this company sell?
- Which plan is meant for someone like you?
- Roughly what would it cost you?
If a first time visitor can't answer those three questions after a five second glance, the page is failing before any of your clever pricing ideas get a chance to work. The staircase, the anchor, the upgrade math: none of it matters to a customer who has already decided the page is too much effort.
Jordan turned that idea into eight checkpoints, each tied to a specific part of the page.
Some of these are about clarity, like whether each plan says who it's for. Some are about structure, like whether one plan is clearly recommended. And a few are about trust, like whether the customer can see what happens if they outgrow a plan or want to leave. Two of them turned out to matter far more than Jordan expected, and both have decades of research behind them.
More choices, fewer buyers
In 2000, psychologists Sheena Iyengar and Mark Lepper set up a tasting table at an upscale grocery store in California. On some hours the table offered 24 flavors of jam. On others, just six.
The big display was better at getting attention. About 60 percent of passing shoppers stopped at the 24 jam table, compared with 40 percent at the six jam table. But when it came to buying, the result flipped. Only about 3 percent of the people who stopped at the big display went on to buy jam, compared with roughly 30 percent at the small one.
Put in terms of every hundred people walking by, the big table produced about two buyers. The small table produced about twelve. More choice drew a crowd and then froze it.
It's worth being honest about this study, because it gets quoted a lot. Later research found that choice overload is real but conditional. It shows up most strongly when options are hard to compare, when people don't already know what they want, and when the decision feels complicated. That is not a reason to ignore it. It's a precise description of most B2B pricing pages.
Jordan did the math on her own page. Four plans. Two billing periods. Zero, one, or two reminder packs. That was 24 possible combinations, the same number as the jam table. She had built the big display without realizing it.
The option nobody picks
The second lesson comes from a classroom demonstration by behavioral economist Dan Ariely, built on a real subscription page from The Economist. The magazine offered three options: web only for $59, print only for $125, and print plus web, also for $125.
No sensible person picks print only when print plus web costs the same. When Ariely put the three options in front of 100 students, nobody did. Sixteen chose web only, and 84 chose print plus web.
Then he removed the option nobody picked and asked a fresh group of 100. This time, 68 chose web only and just 32 chose print plus web.
An option that nobody chose changed what everybody else chose. With it on the page, the $125 bundle looked like an obvious bargain, because there was something right next to it that was clearly worse. Without it, the same bundle just looked expensive next to $59. Across 100 buyers, the difference was about 43 percent more revenue. It was a classroom exercise rather than a live test, so treat the exact figures with some caution, but the direction has held up across many studies of what researchers call the decoy effect.
The lesson for pricing pages is not to invent fake options. It's that customers never judge a plan on its own. They judge it against whatever sits beside it. Every plan on your page changes how every other plan looks, and the most useful comparisons are the ones the customer can see without doing math.
That was exactly Jordan's problem. Her page technically offered the same honest comparison The Economist did: a Starter customer who added two reminder packs paid $99, the same price as Plus, which included the reminders plus online booking and a waitlist. But the page made customers discover that themselves by adding up line items. Nobody was going to do that in five seconds.
Prices are read, not calculated
One more piece of research shaped Jordan's review. In a series of field experiments with a women's clothing catalog, marketing professors Eric Anderson and Duncan Simester tested what happened when prices ended in 9. The 9 ending increased demand in all three experiments, and the effect was strongest for new items, where customers had the least information to judge the price.
The takeaway for a B2B page isn't to end every price in 9. It's that customers don't carefully calculate prices. They read them quickly, and they read them in whatever unit makes sense to them. When customers have little else to go on, small cues in how a price is shown carry a lot of weight.
Cadence priced by the clinic per month. Denise thought in providers. She kept trying to work out what Growth would cost per doctor, because that was how her practice budgeted everything else. The price was fine. The unit was foreign.
The scorecard
Jordan turned all of this into a one page scorecard. Eight questions, each scored from one to five, with a short description of what a strong answer looks like.
She scored the Cadence page honestly, then asked two colleagues from outside the product team to score it too, and averaged the results. The pattern was humbling.
The structure was strong. The staircase, the anchor, and the upgrade math all scored well, because that's where Jordan had spent the last two months. But the page scored poorly on the things a first time visitor notices first: whether they can tell which plan is for them, how many decisions they have to make, and whether anything is recommended. Jordan had built excellent pricing and a confusing page to sell it on.
What Jordan changed
The redesign took two weeks, and most of it was subtraction.
First, she added a single question above the plans: "How many providers are in your practice?" Choosing an answer highlighted the plan most practices that size use. Twenty four combinations became one recommendation, and everything else stayed a click away.
Second, she gave the page a default. The Growth card now carried a simple label, "Most practices your size choose this." It was true, it was specific, and it gave hesitant visitors permission to stop comparing.
Third, she moved reminder packs, messaging credits, and the enterprise details into a section below the plans called "Everything else." Nothing was removed. It just stopped competing for attention in the first five seconds.
Fourth, she made the key comparison visible. One line under the Plus card now read: "Starter with two reminder packs costs $99. Plus costs $99 and adds online booking and a waitlist." The honest version of The Economist's decoy, shown instead of implied.
Fifth, she spoke Denise's language. Each plan now showed an estimate in the customer's own unit, such as "About $45 per provider for a four provider practice," right beneath the monthly price.
Last, she added the reassurance that had been buried in the footnotes: a free trial, what happens if a clinic goes over its limits, and how cancellation works.
Denise agreed to look at the new version a week later. She picked a plan in eleven seconds. Over the following month, the share of pricing page visitors who started a trial rose from about 3.8 percent to about 5.6 percent, and the sales team reported that questions about which plan to choose had roughly halved.
Borrowing the playbook
The hardest part of reviewing your own pricing page is that you know too much. You know why every element is there, which means you can no longer see what it's like to meet the page cold. The fix isn't more cleverness. It's borrowing someone else's eyes.
For product managers, a few habits make that easier.
- Test the glance, not the read. Show the page for five seconds to someone who has never seen it, then ask what you sell, which plan fits them, and what it costs. If they can't answer, start there.
- Count combinations, not plans. Three plans with toggles and add ons can quietly become two dozen decisions. Every extra choice has to earn its place in the first screen.
- Make the comparison obvious. Customers judge each plan against its neighbors. Put the comparison that favors your recommended plan in plain sight instead of hoping they'll work it out.
- Speak in the customer's unit. Price the way your model works, but translate it into the unit your customer budgets in.
- Recommend something. A clear default is not pushy. It's a relief to a buyer who doesn't want to become an expert in your pricing to make a decision.
- Score it every quarter. Pricing pages drift as new ideas get added. A simple scorecard keeps the page as good as the pricing behind it.
Jordan keeps a printout of the scorecard pinned above her desk now, with Denise's eleven seconds written in the corner. It's the most useful number on the wall.
Your customer won't read your pricing page. They'll glance at it, and decide.
Sources
- Iyengar and Lepper jam study results, including the counts of shoppers who stopped and bought, via Rejoiner (opens in a new tab) and Lumen Learning (opens in a new tab)
- Discussion of the jam study and later research on when choice overload appears, via Jason Collins (opens in a new tab)
- The Economist subscription experiment described by Dan Ariely, via Wikipedia's summary of the decoy effect (opens in a new tab) and Sketchplanations (opens in a new tab)
- Anderson and Simester, Effects of $9 Price Endings on Retail Sales (opens in a new tab), Quantitative Marketing and Economics, 2003
Revenue per 100 buyers in the decoy example is calculated from the reported choices and prices. Jordan, Denise, and Cadence are fictional, and the Cadence figures are illustrative.
Questions people ask
What is the five second test for a pricing page?
Show the page to someone who has never seen it for five seconds, hide it, and ask three questions: what does this company sell, which plan is meant for someone like you, and roughly what would it cost you? If they can't answer, the page is failing before any pricing strategy gets a chance to work.
Does choice overload apply to pricing pages?
Often. In the classic jam study, a 24 jam display drew more shoppers but produced about 2 buyers per 100 passersby against about 12 for 6 jams. Later research finds the effect is strongest when options are hard to compare and buyers don't know what they want, which describes most B2B pricing pages.
What is the decoy effect in pricing?
An option few people choose can change what everyone else chooses, because customers judge each plan against its neighbors. In Dan Ariely's Economist demonstration, a print only option nobody picked moved most students to the $125 print and web bundle. The honest lesson is to make your key comparison visible, not to invent fake options.
What should a pricing page show to convert better?
Who each plan is for, as few decisions as possible on the first screen, one honest recommended plan, small steps between plans, a visible top tier, prices in the customer's own unit, the key upgrade comparison spelled out, and answers to trial, limits and cancellation questions.
Putting this into practice
How Product Advisory helps teams with this: